Assembling citizenship
and participation
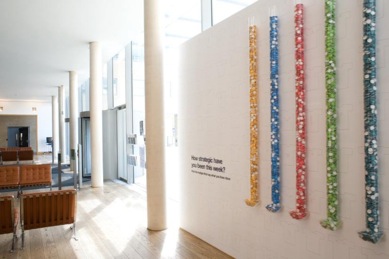
In Physical Bar Charts, viewers are presented with 2m see-through tubes containing button badges, each with a specific message on. Visitors are prompted by a question to help themselves to badges. As they do so, the levels in the tubes drop, answering the question and presenting an inverse bar chart showing the popularity of the badges and of the activities described on them.
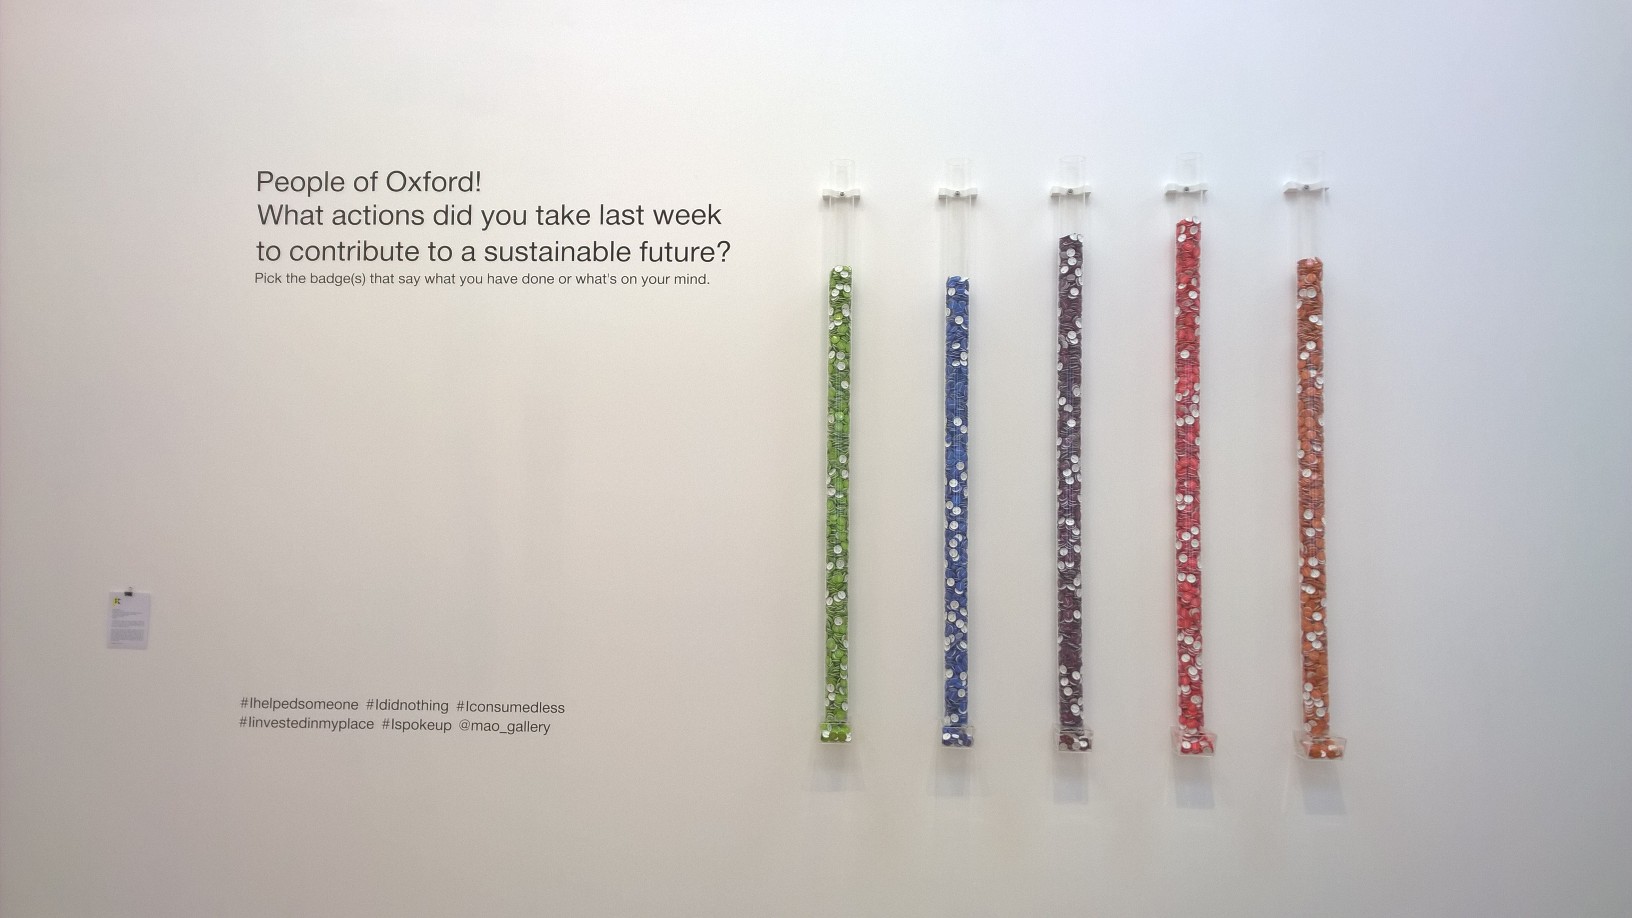
In Physical Bar Charts, viewers are presented with 2m see-through tubes containing button badges, each with a specific message on. Visitors are prompted by a question to help themselves to badges. As they do so, the levels in the tubes drop, answering the question and presenting an inverse bar chart showing the popularity of the badges and of the activities described on them.
Together, the Physical Bar Charts are an example of social data gathering, collaborative sense-making, playful research, real-time reporting, and experiential inquiry. They spark conversations and prompt a community such as TED to reflect on its concerns and practices.
Alongside the
tubes are postcards asking visitors to predict the levels in the tubes
on a future date. Depending on the messages on the badges, and the
location in which the tubes are placed, the Physical Bar Charts make
public the views of anonymous participants. As people walk around
wearing the badges, a temporary community is formed.
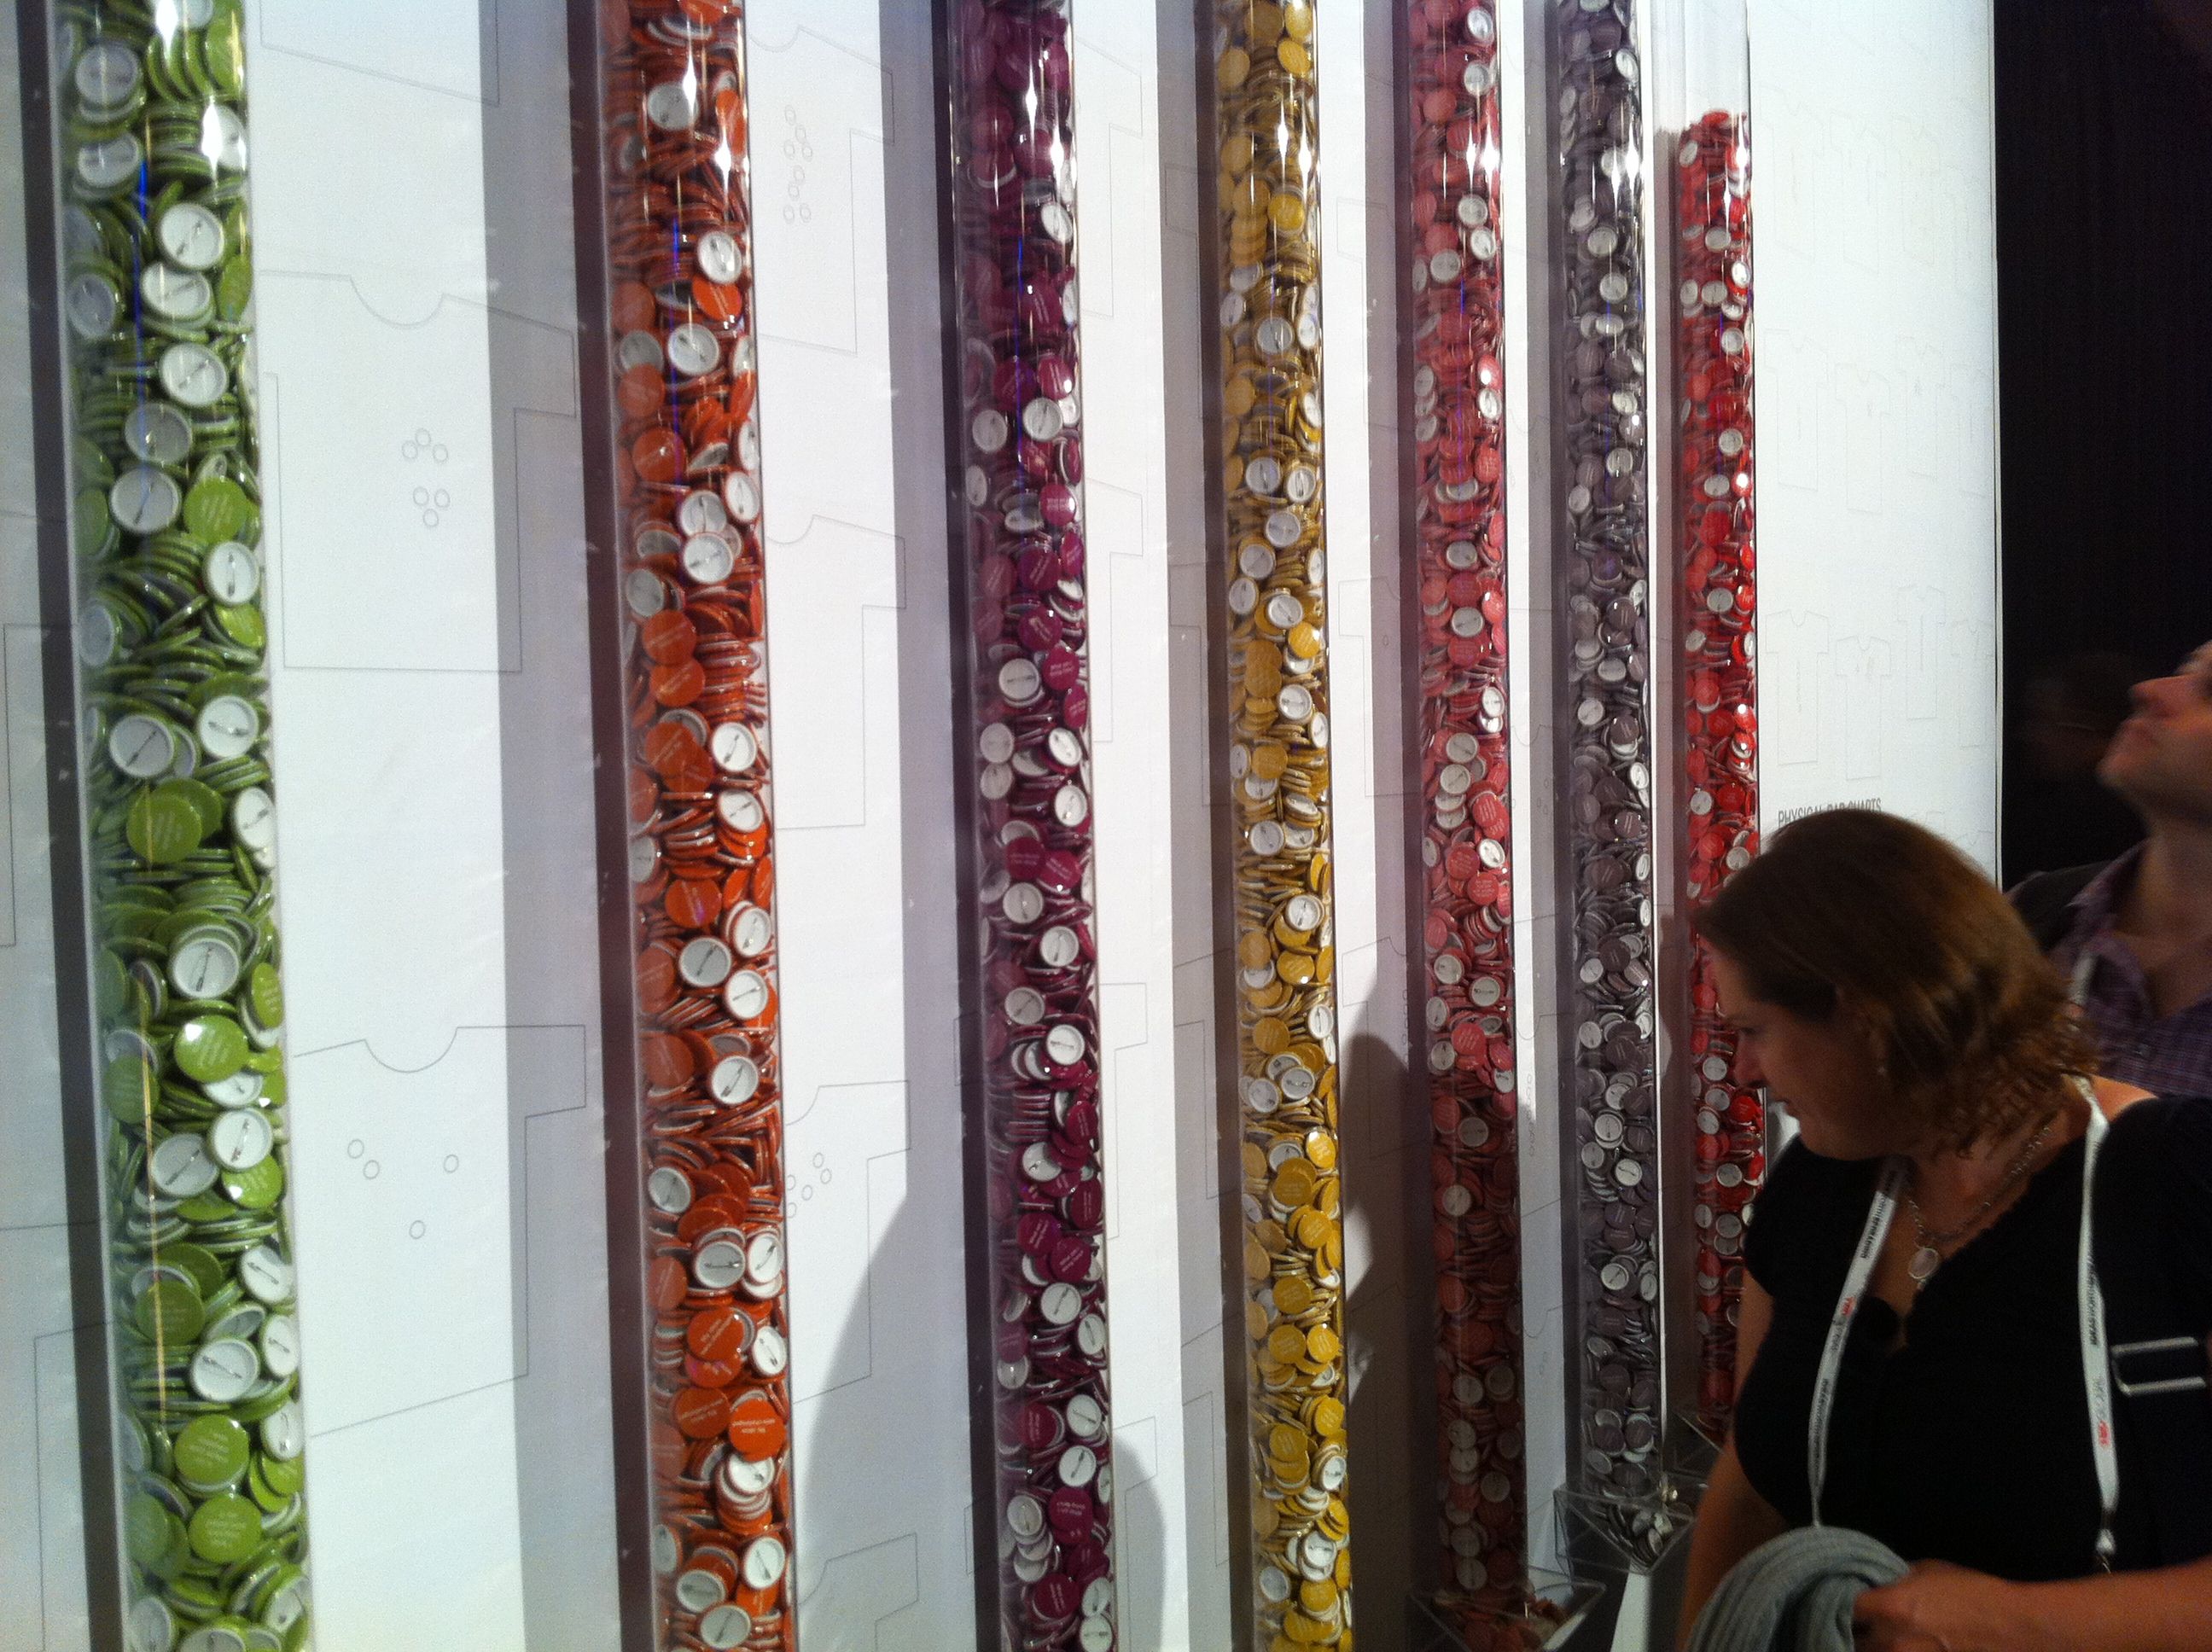
Above: Close up of Physical Bar Charts at TEDGlobal 2011
Below: ‘How strategic have you been this week?’
Photo
from
Imagining
Business,
Said Business School, Oxford, June 2008
Physical
Bar
Charts

Participative
time-based
installation
A
development
from
Pindices,
a collaboration with sociologist Andrew Barry.
Physical
Bar Charts was shown in the group show Future Knowledge, at
Modern Art Oxford in May/June 2017. This one called out 'People of
Oxford! What actions did you take last week to contribute to a
sustainable future? The badges had texts including different behaviours
people take in relation to the environment:
Physical Bar Charts was first shown in the touring exhibition Day to Day Data at Angel Row Gallery, Nottingham in 2005, when also travelled to two other UK cities. For this exhibition the vinyl text asked ‘citizens’ what they did the previous week. The badges had the following texts on:
- I consumed less
- I helped someone
- I did nothing
- I invested in my place
- I spoke up
Physical Bar Charts was first shown in the touring exhibition Day to Day Data at Angel Row Gallery, Nottingham in 2005, when also travelled to two other UK cities. For this exhibition the vinyl text asked ‘citizens’ what they did the previous week. The badges had the following texts on:
-
•I spoke up
-
•I helped someone
-
•I got by
-
•I made a stand
-
•I did nothing
At TEDGlobal 2011 in Edinburgh, participants to the conference were asked to make public what they had done at TED or what was on their mind, using these badges:
- I surprised myself
- I was inspired and acted upon it
- My ideas were challenged
- What am I doing here?
- I stayed up too late last night
- My ideas had sex with another TEDster's
- I delayed judgement
- I said what I believe
The
version
at
Said
Business School in the exhibition Imagining
Business, June 2008, asks
passers-by to consider how strategic they have been this week and has
badges with these texts:
-
•I made mistakes
-
•I saw the big picture
-
•I thought then acted
-
•I acted then thought
-
•I used Powerpoint
Image:
Physical Bar Charts installed
in Modern Art Oxford, in group show Future , 2017